A replay of Samp‘s webinar on 30th January 2025.
PART 2: focus on flowcharts, PFD, P&ID
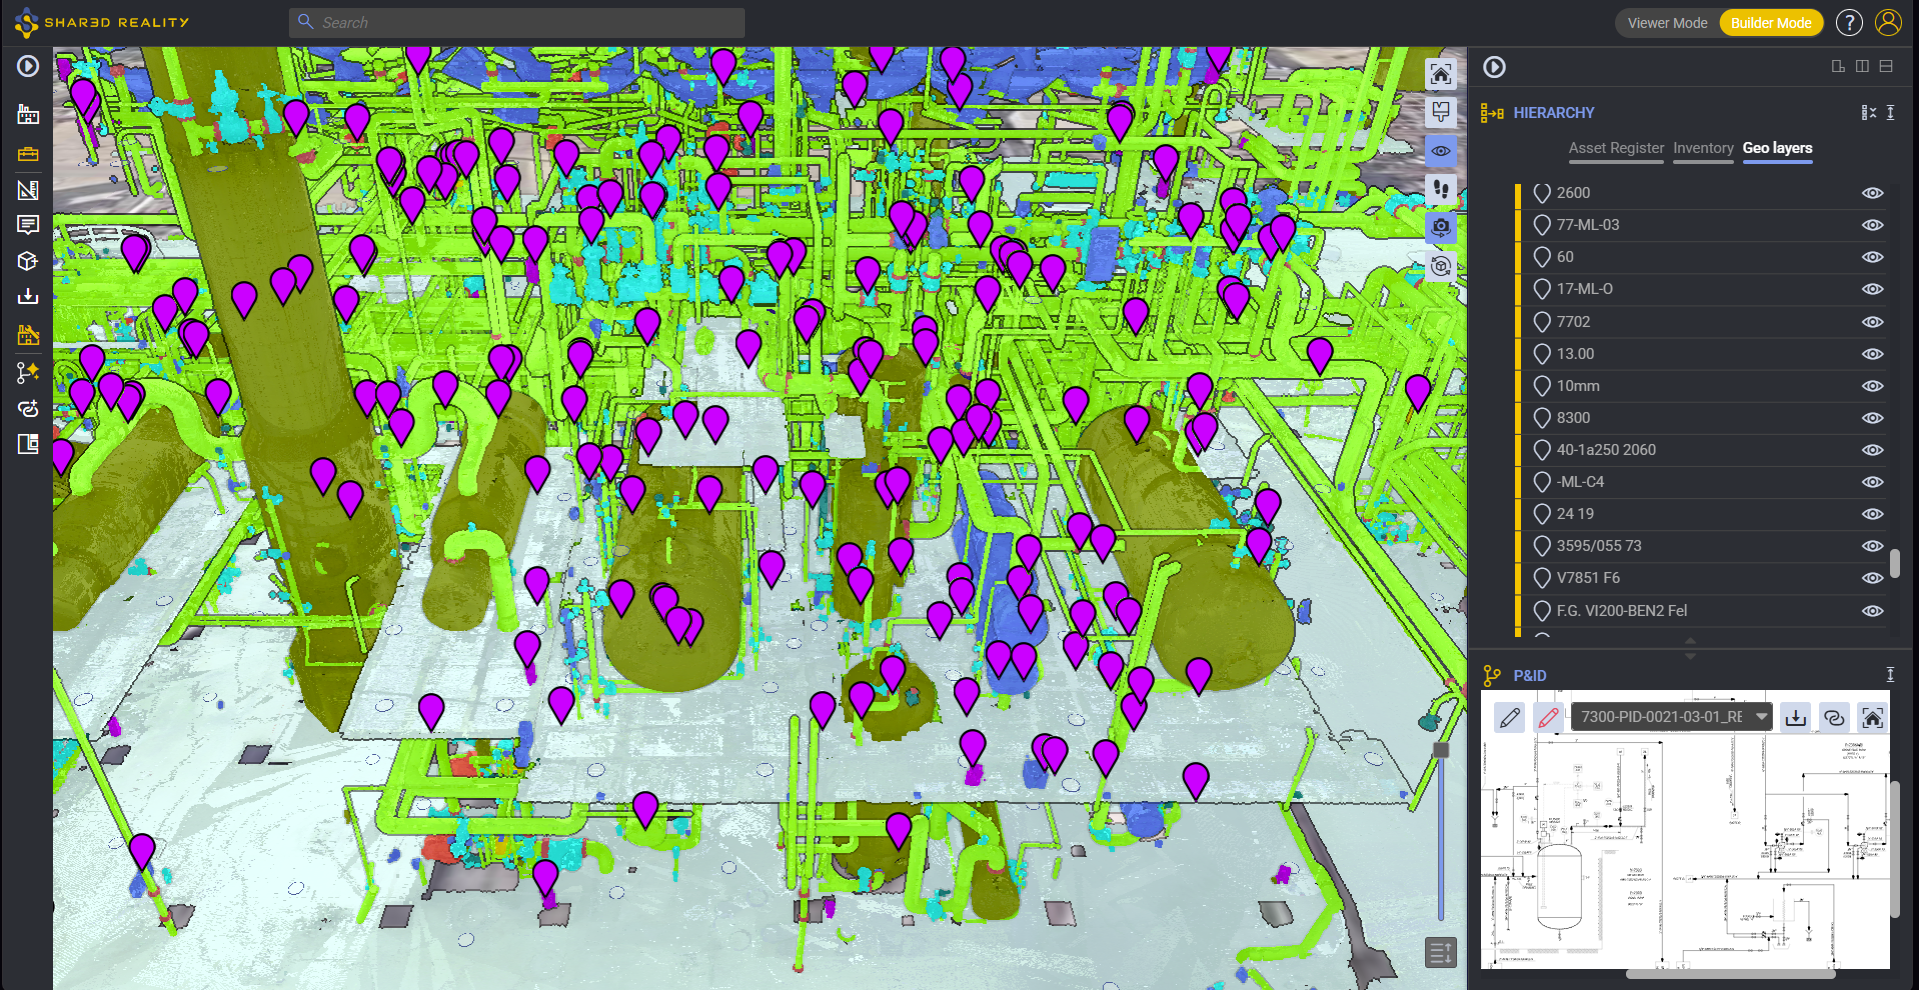
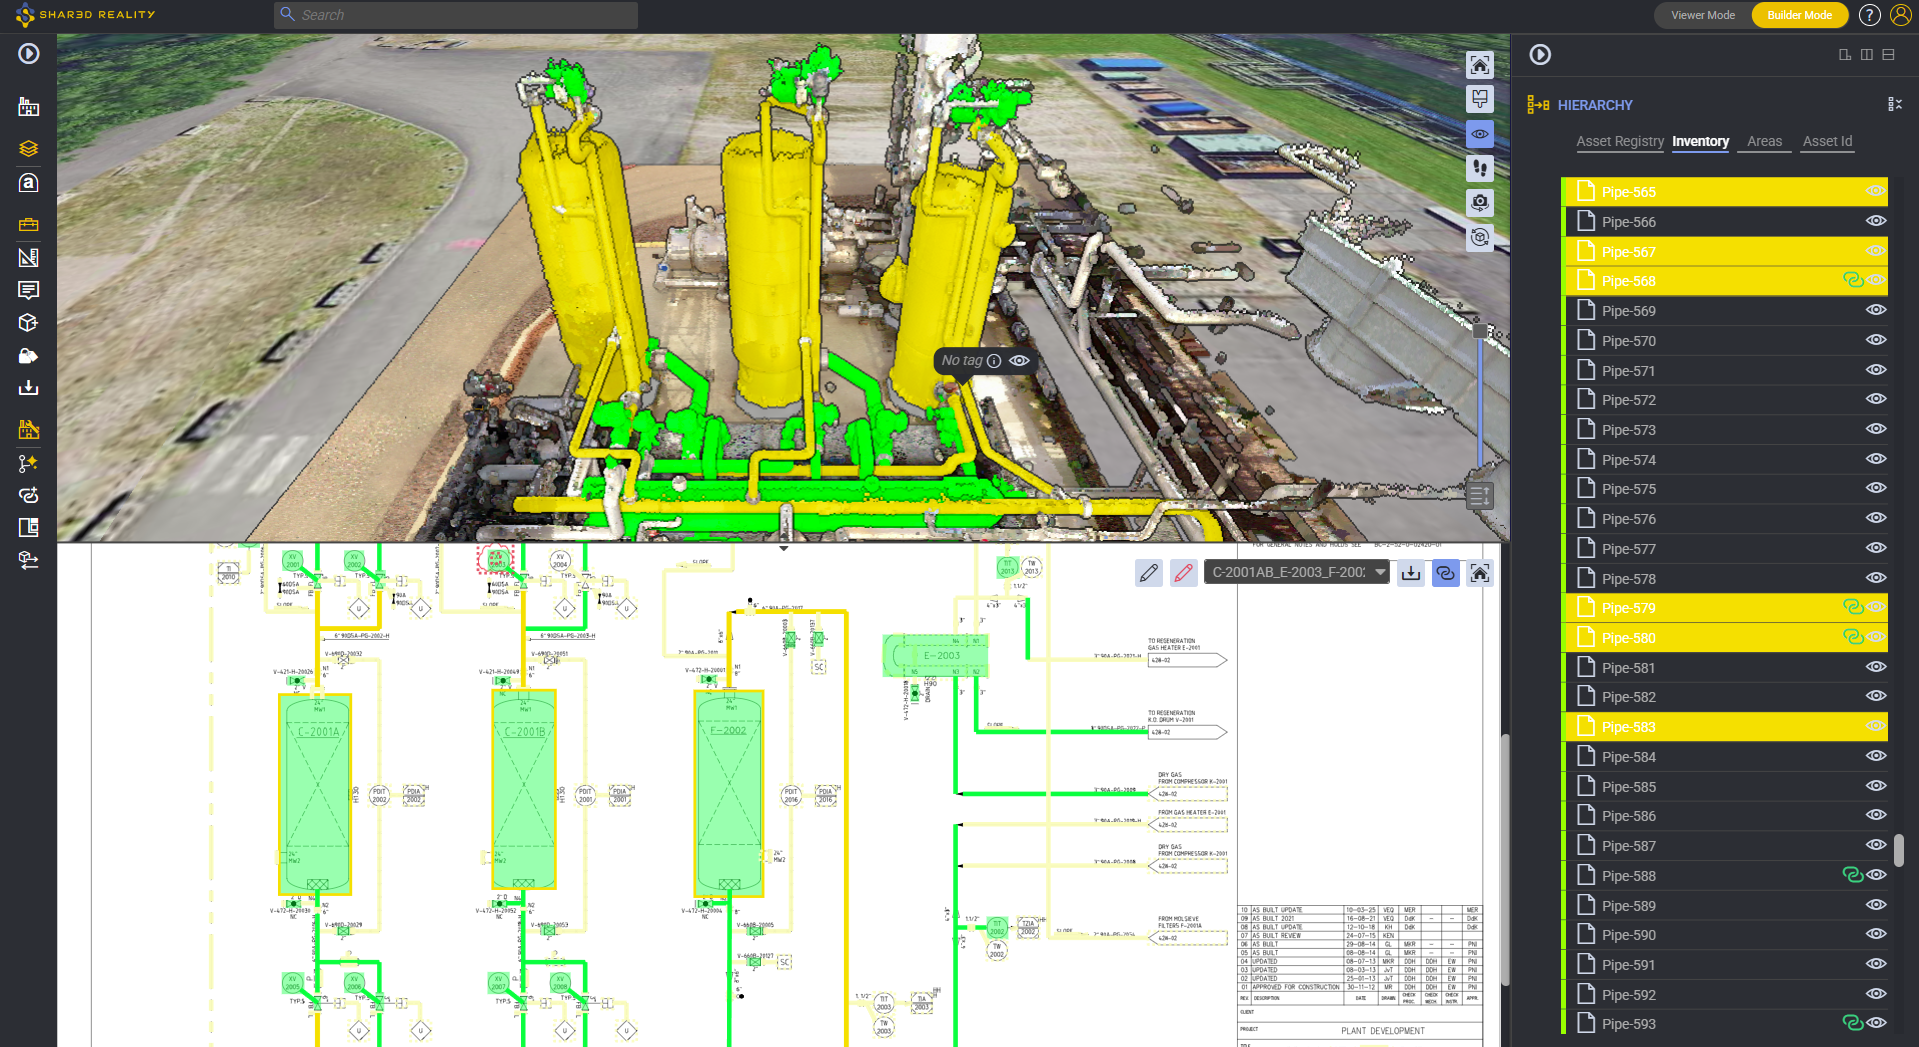
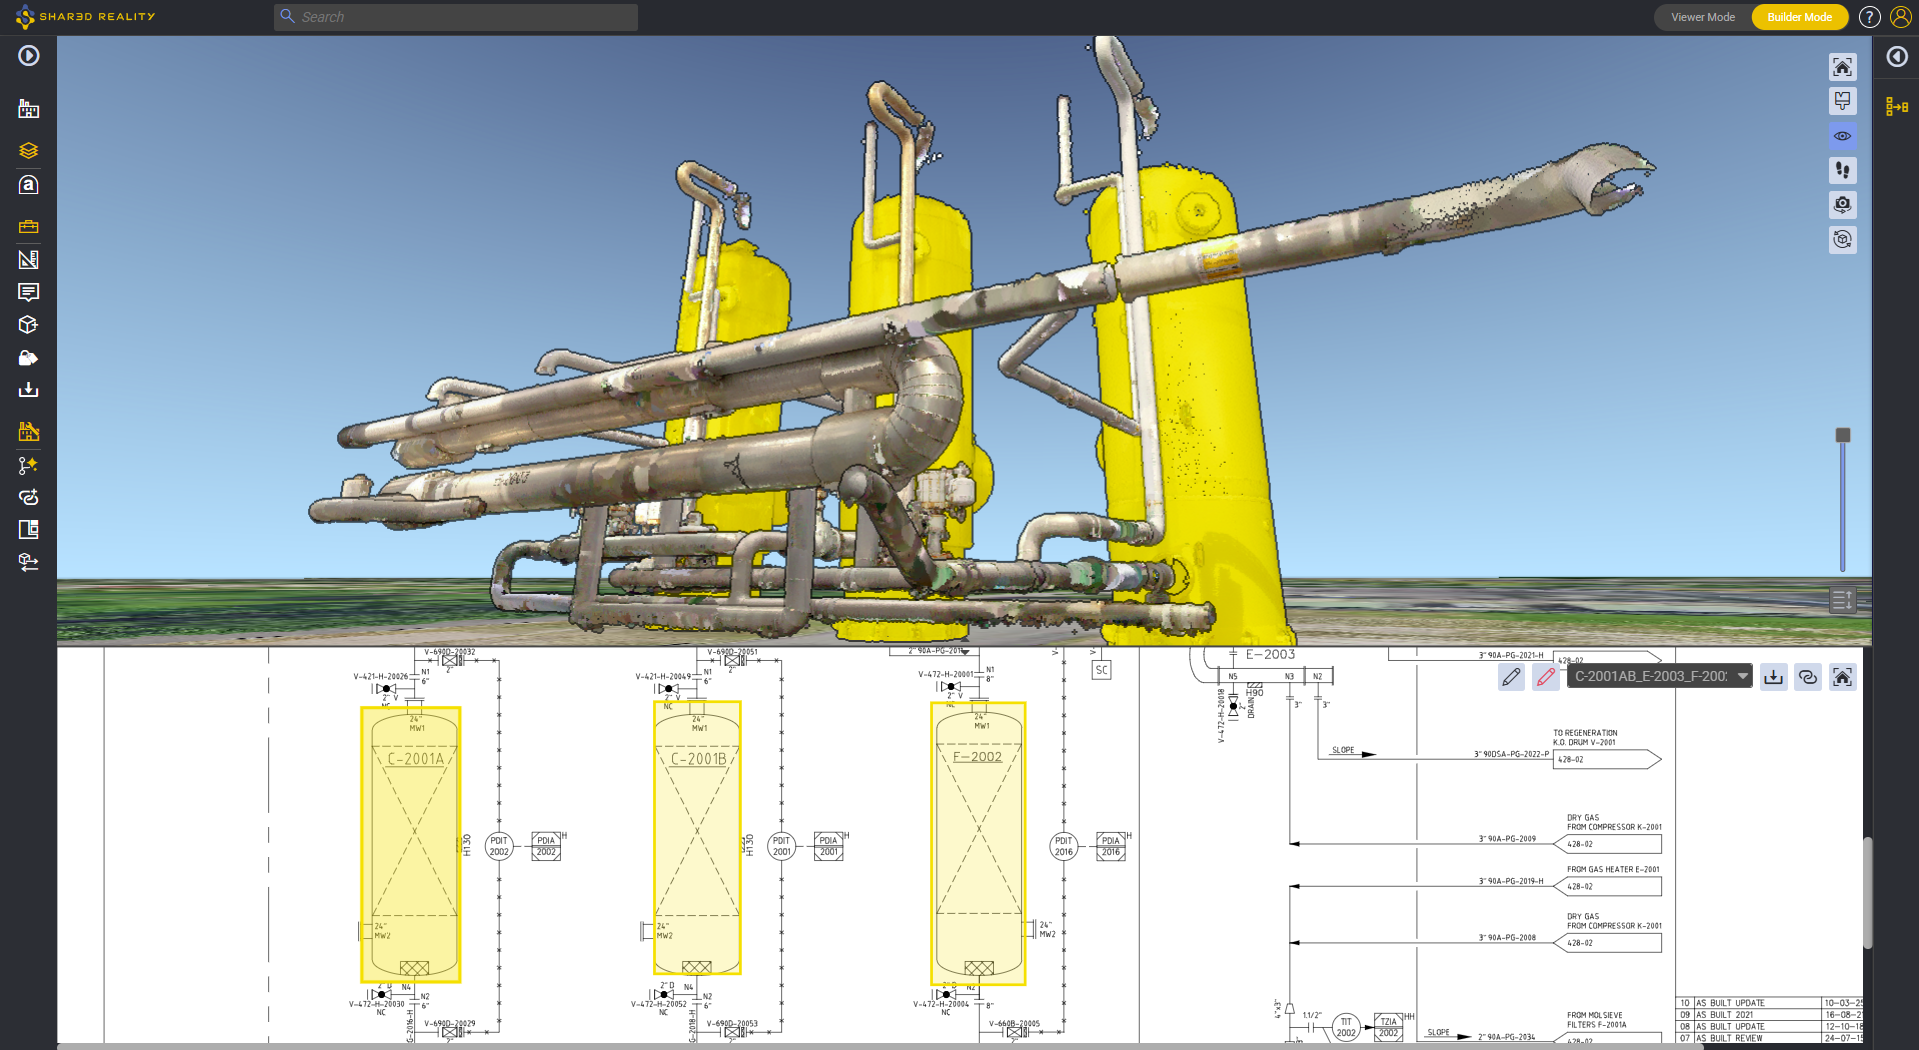
In this webinar replay you will discover how Shared Reality helps you to clean-up flowchart data in a visual way.
Whether your flowcharts are incomplete or outdated, you will discover how to use the power of visually verifying & improving their consistency and completeness by easily linking, filtering, and redlining PFD or P&ID with 3D reality capture.
This approach fosters a continuous improvement cycle that keeps your teams or contractors engaged and empowered, no matter their discipline or seniority level.
Are you ready to learn why Shared Reality should be rolled-out when STARTING your data quality projects, boosting your records cleansing performance, thanks to a 3D digital twin working seamlessly with your current flowcharts and existing asset management system.
Access the replay to find out more.
Fill out the request form to access the recording
Speakers

Thomas Grand
Chief Operating Officer
Samp.ai

Nikola Primetica
Customer Success Manager
Samp.ai