Your drawings say one thing, the field says another: why the gap keeps growing
Picture a familiar morning. A planner prepares a job from the diagram, the team walks out to the unit, and the line on the drawing doesn’t match what stands in front of them. A valve has moved. A bypass was added during the last shutdown. Nobody updated the drawing.
None of this comes from carelessness. It comes from a simple imbalance: an industrial site changes every day, while its technical information changes much more slowly.
The site never stops changing
Every maintenance job, repair and small modification changes the plant a little. Most of these changes are sensible and well executed. The problem is what happens afterwards.
The change is done in the field. The record of that change has to travel back to the office, be reviewed, be drafted and be published. Each step takes time and competes with urgent work. So the field moves on, and the drawings stay behind.
The scale is significant: around 30% of P&IDs contain discrepancies with what is actually installed.
Three reasons the gap keeps growing
- Changes outpace updates. A modification can be completed in a day. Updating every diagram it touches can take weeks, especially when drafting resources are shared across many requests.
- Reporting a discrepancy is harder than it should be. The people who notice differences are on site: operators, technicians, contractors. Their observations often end up in a notebook, a phone photo or simply in memory. Without an easy way to report what they see, in context, much of it never reaches the people who maintain the drawings.
- Checking means going back to site. To confirm a discrepancy, someone usually has to walk the unit again. That takes time, travel and, in some areas, exposure to risk. So checks are postponed, and doubt accumulates.
What the gap costs
Outdated drawings rarely cause one dramatic failure. They cost a little, every day.
- Maintenance tasks need extra site visits because nobody trusts the drawing.
- Contractors quote and plan from information that may not match the site.
- Each change review starts from a baseline that has to be re-verified first.
- Experienced people spend time answering “is this still right?” instead of solving problems.
Over time, teams learn to work around the drawings rather than with them. That is the real risk: once people stop trusting technical information, they stop using it.
What closing the gap looks like
Teams that keep diagrams aligned with the field tend to share four habits.
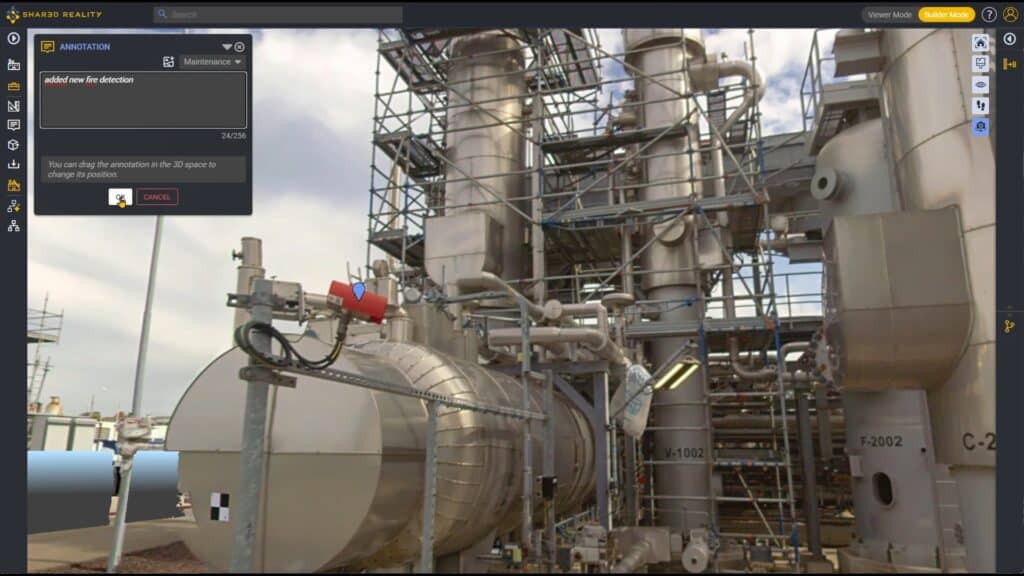
- Make reporting effortless for the field. Anyone on site can flag a difference where they see it, with a photo and a short note.
- Review discrepancies with the site in view. Engineers can see the actual equipment and its surroundings before deciding what to change, without travelling first.
- Update in context. Corrections are marked up directly on the diagram, linked to the place on site they refer to.
- Make it routine, not a project. Small, continuous corrections replace occasional large campaigns.
None of this requires replacing the systems teams already use. It requires a shared view of the site that the field and the office can both work from.
How teams are doing it today
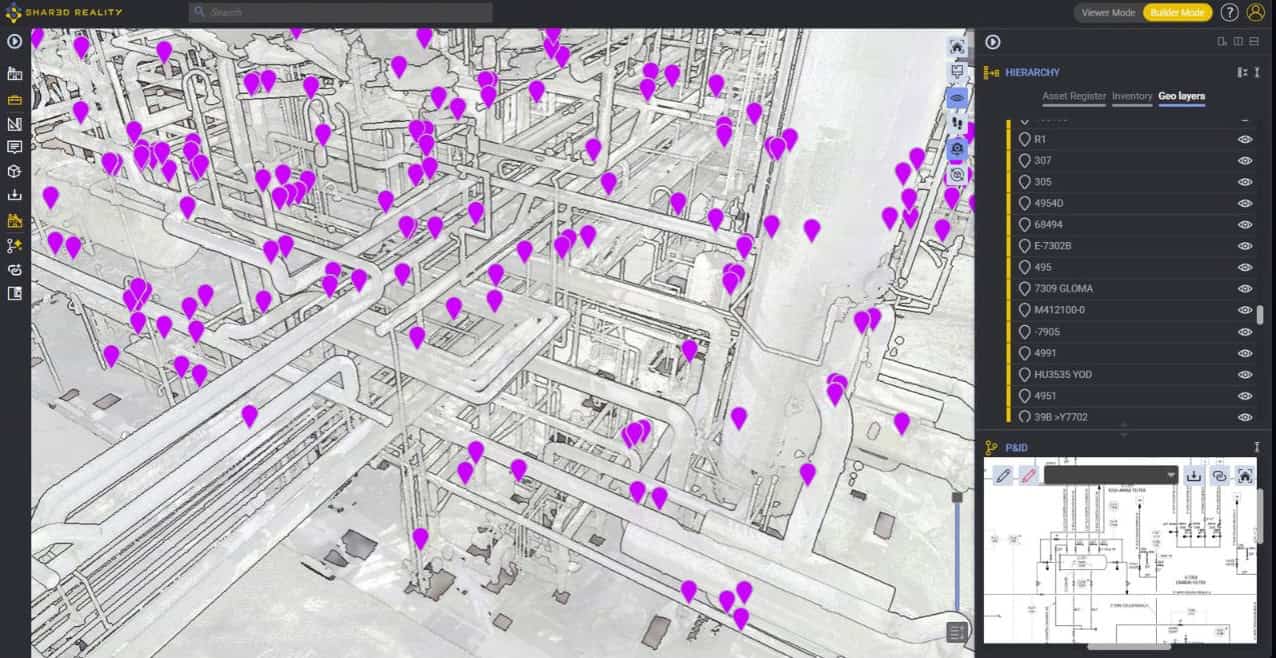
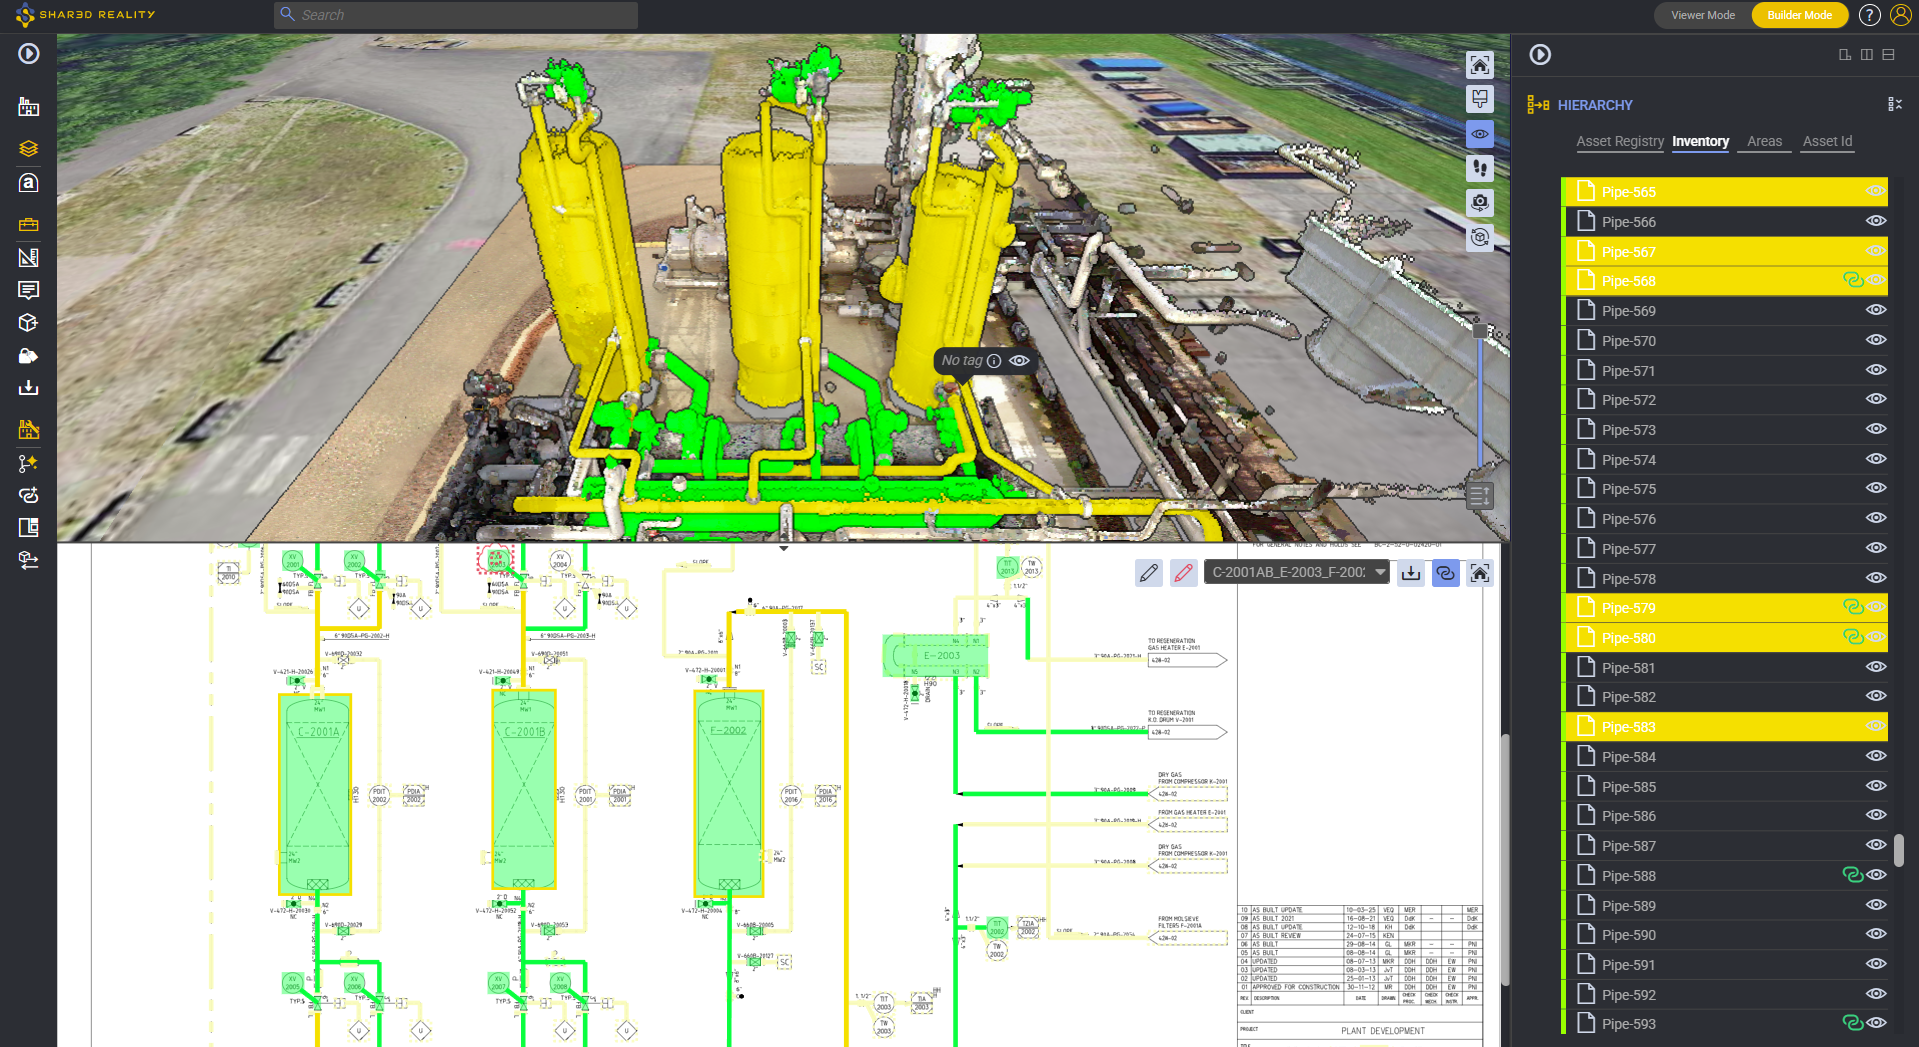
This is the gap Shared Reality is designed for. It turns 3D scans of a site into a 3D reality model and helps you link it to your P&IDs, so each diagram sits next to the equipment it describes and discrepancies between technical information and field reality become visible.
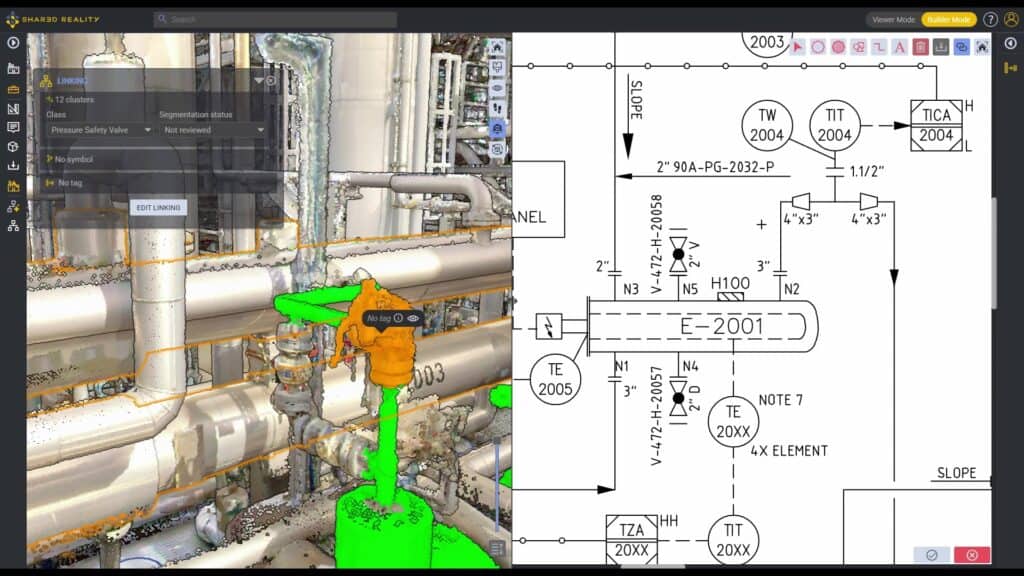
Anyone with access opens it in a browser, with nothing to install: internal teams, contractors and subcontractors, each with secure access set by role.
In that shared view, field teams and contractors can leave observations exactly where they see a difference, with text and images. Engineers can then do a virtual walkdown of the area, compare what is installed with what is drawn, and redline the diagram in context. When the corrected diagram is republished, its links to the site stay in place.
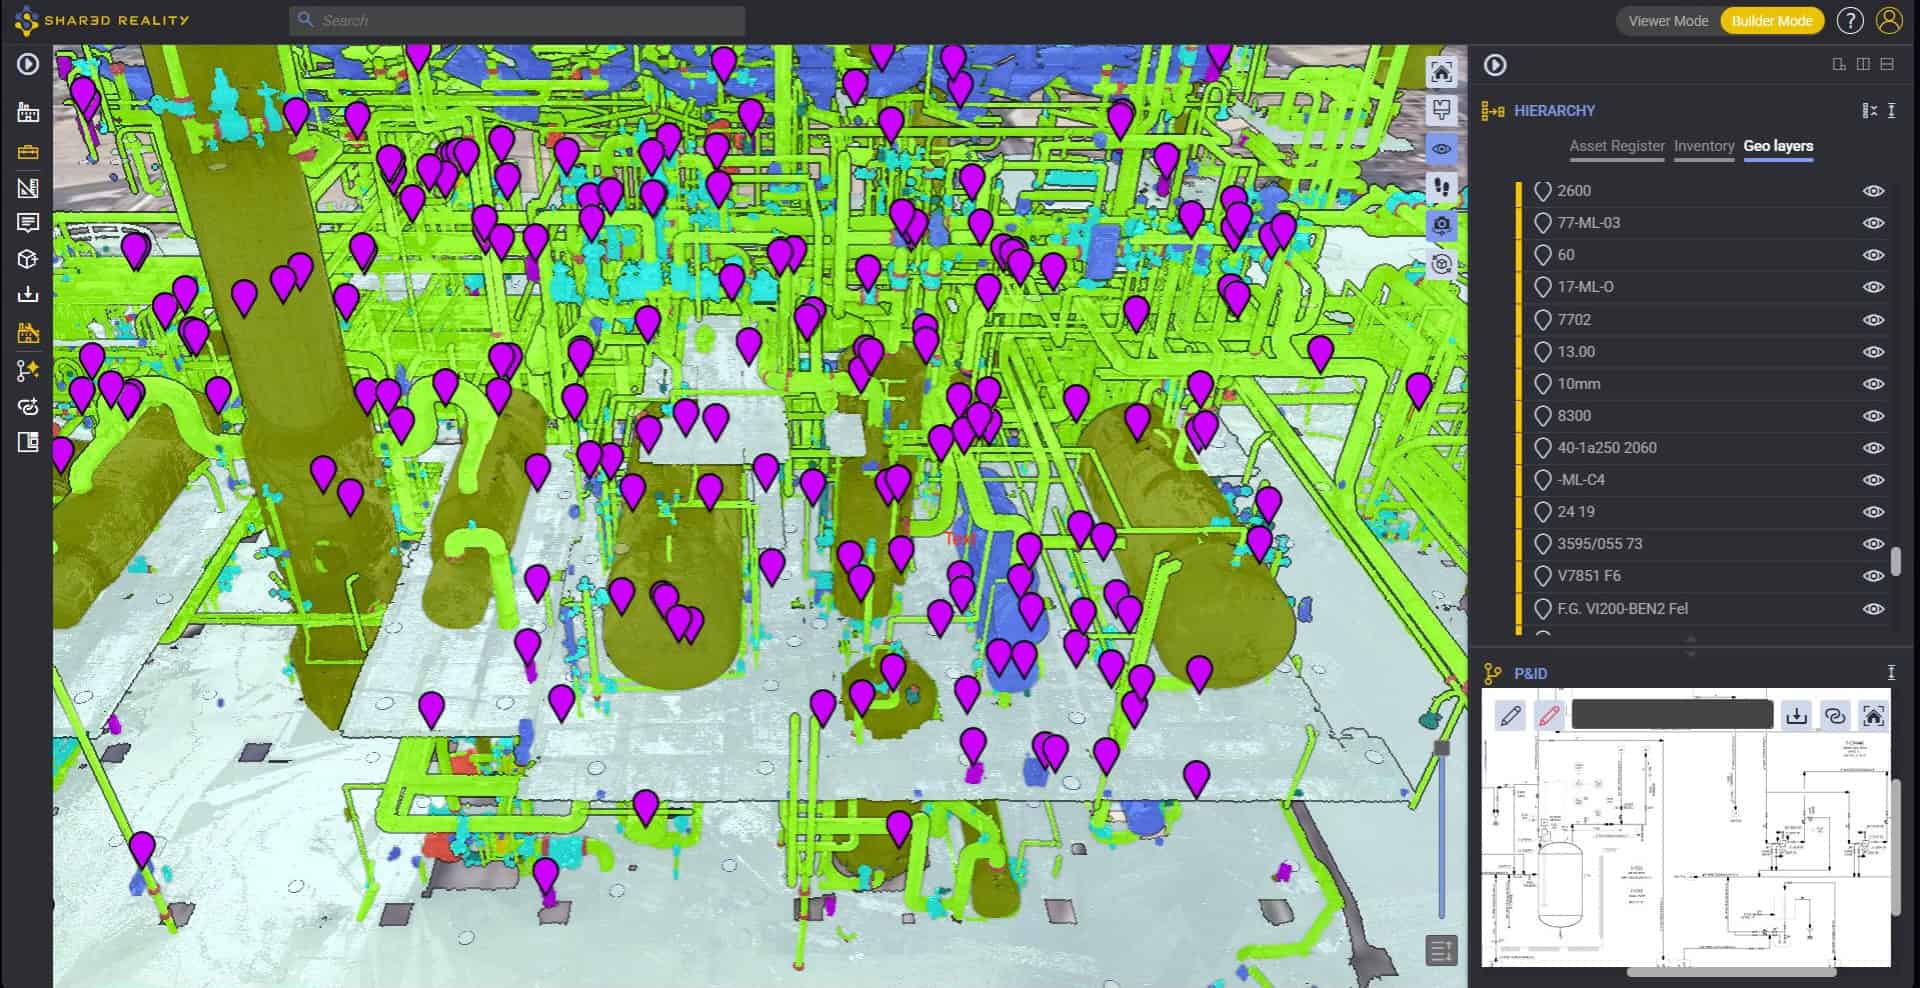
4. Transforming Monolithic Scans into Semantic Reality Models
Once physical labels are converted into spatial anchors, the facility scan transitions from a passive geometric record into a semantic 3D reality model. Every classified component becomes an active, interactive entity wired directly into the plant’s broader data architecture.
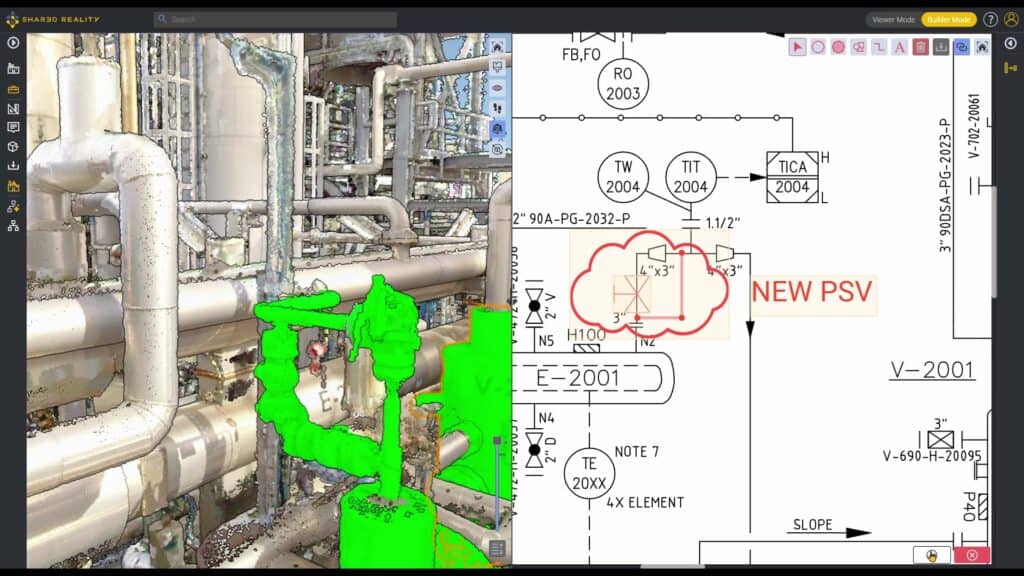
The result is a feedback loop between the field and the office that no longer depends on another site visit. Teams using Shared Reality correct diagrams up to 30x faster.
Start with one unit
You don’t need to fix every drawing at once. Pick one unit with frequent changes, make it easy for the field to report what they see, and measure how long a correction takes from observation to updated diagram. That number tells you more about the health of your technical information than any audit.
In the coming weeks, this series looks at what the gap means for maintenance preparation, Management of Change and turnaround planning. Follow Samp on LinkedIn to catch the next article.